Your whole plant, in one place

The Maptronics platform gathers what today lives scattered across spreadsheets, stray screens and the shift’s memory: production, stops, logbooks and reports, in one place.

Your whole plant, in one place

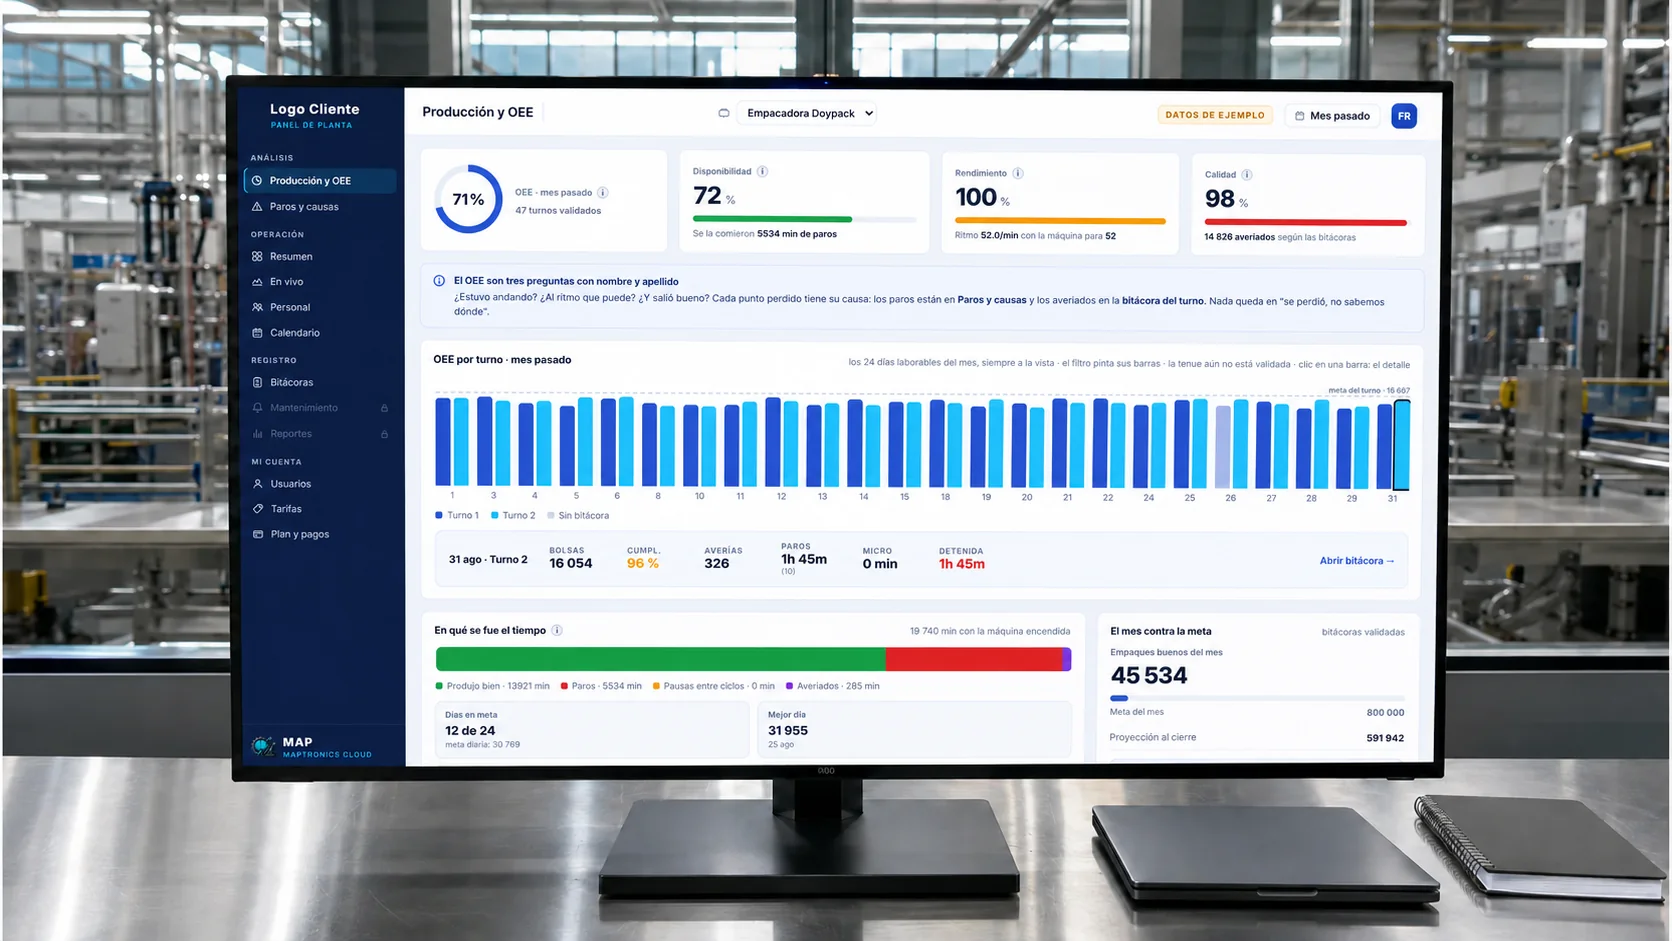
Production & OEE

How much it produced, at what pace, and where the time went.

  • Validated real production per shift
  • Real pace against the machine’s nominal
  • Losses separated cause by cause

OEE in practice: how long the machine was available, at what pace it produced and how much came out right. The dashboard separates productive time from lost time and puts a cause on every minute that did not produce.
Machine monitoring

Old machines too, without touching the PLC.

  • Production and status live, unit by unit
  • Stops and micro-stops recorded on their own
  • Month-end projection against the target

Any machine that produces units can be monitored, including the one that never had a data output. You watch production advance live and every stop is recorded with its duration, with nobody typing anything.

Predictive maintenance

The data warns you before the stop does.

  • History and trends for every machine
  • Stops and pace drops visible as they happen
  • Analytics to anticipate the failure

Reactive maintenance finds out when the machine has already stopped. With history and trends in sight, the intervention is decided with data: which machine is degrading, since when, and how much it is costing.

Digital logbooks

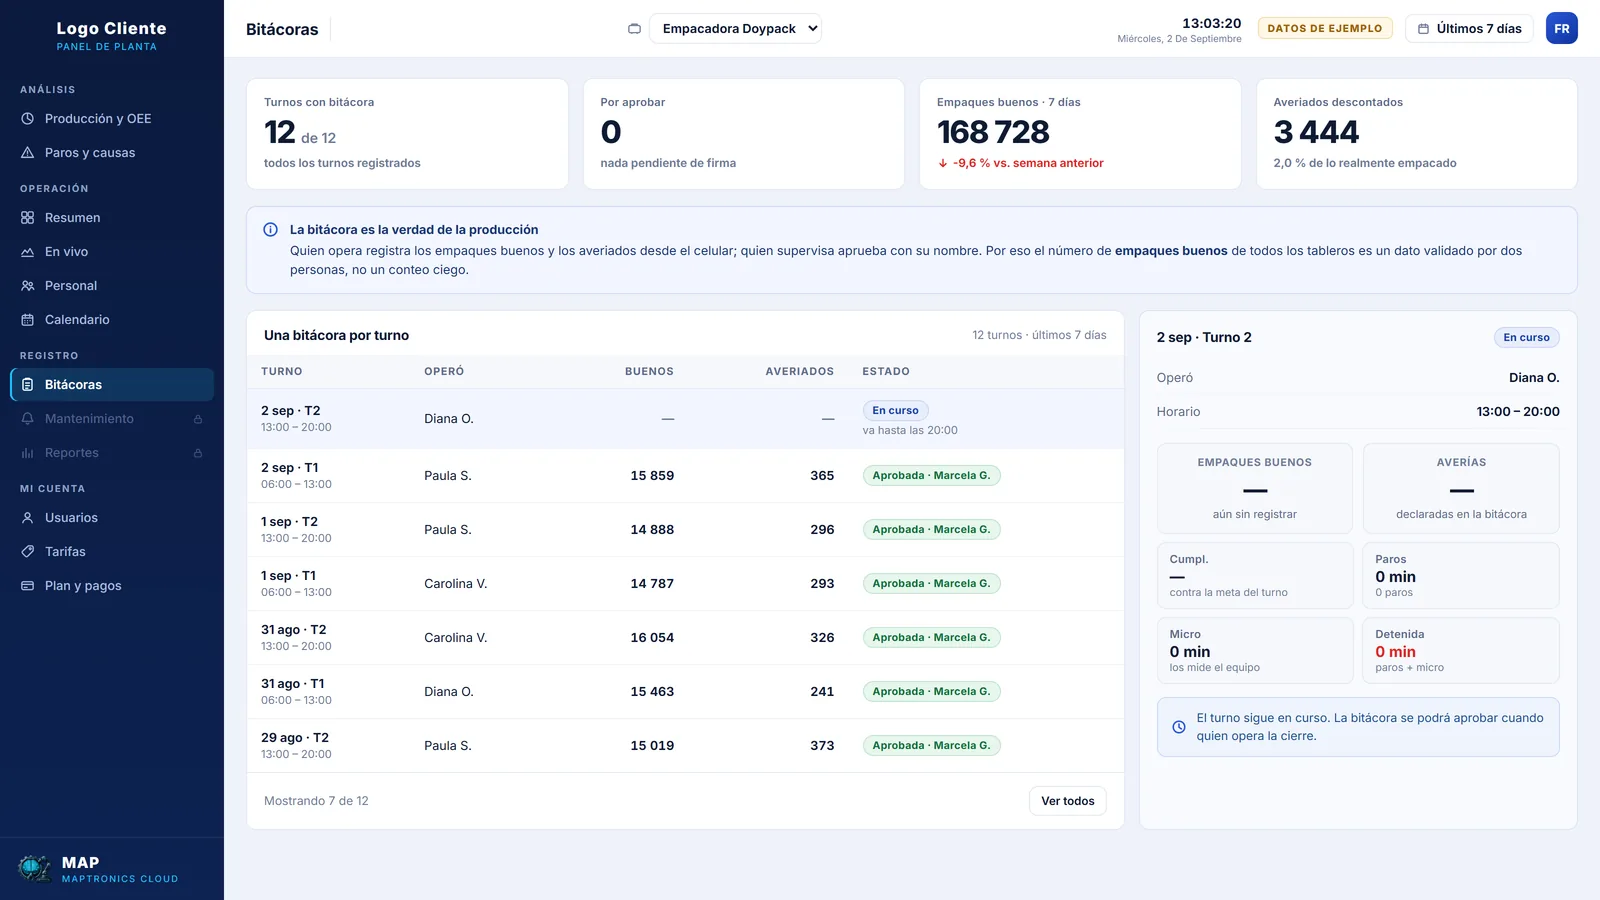
The shift record without paper, from the phone.

  • Operators record from their phones
  • Supervisors approve under their name
  • Cross-checked with what the machine measured

Shift records leave the paper behind: operators fill in from the phone, supervisors approve or return with a comment, and every approval is signed with a name. Since the portal also sees the machine data, the human record and the machine record cross-check on their own.

Machines from any brand, together

Even if they are from different eras and do not talk to each other.

  • Equipment from any brand, on one screen
  • Grouped by plant, by line and by shift
  • Without replacing the control of each machine

The problem: every machine comes with its own screen, so knowing how the plant is doing means walking it machine by machine. Here they all arrive at the same place — whatever the brand or the year — and can be seen together or separately, from a phone or a computer.

Dashboards and reports by role

Everyone sees their part: operator, supervisor, management.

  • Role-based permissions for each person
  • Monthly PDF report from the dashboard
  • AI advisor on the month’s indicators

Not everyone needs to see everything. Operators record, supervisors approve, and management opens the dashboard with the results and the monthly report. The AI advisor reads the month’s indicators and proposes where to start.

What each screen answers

Six screens, six plant-floor questions. These are real captures of the platform, taken on the demo panel with sample data.

Names and figures are examples. In your panel you will see your machine and your people.

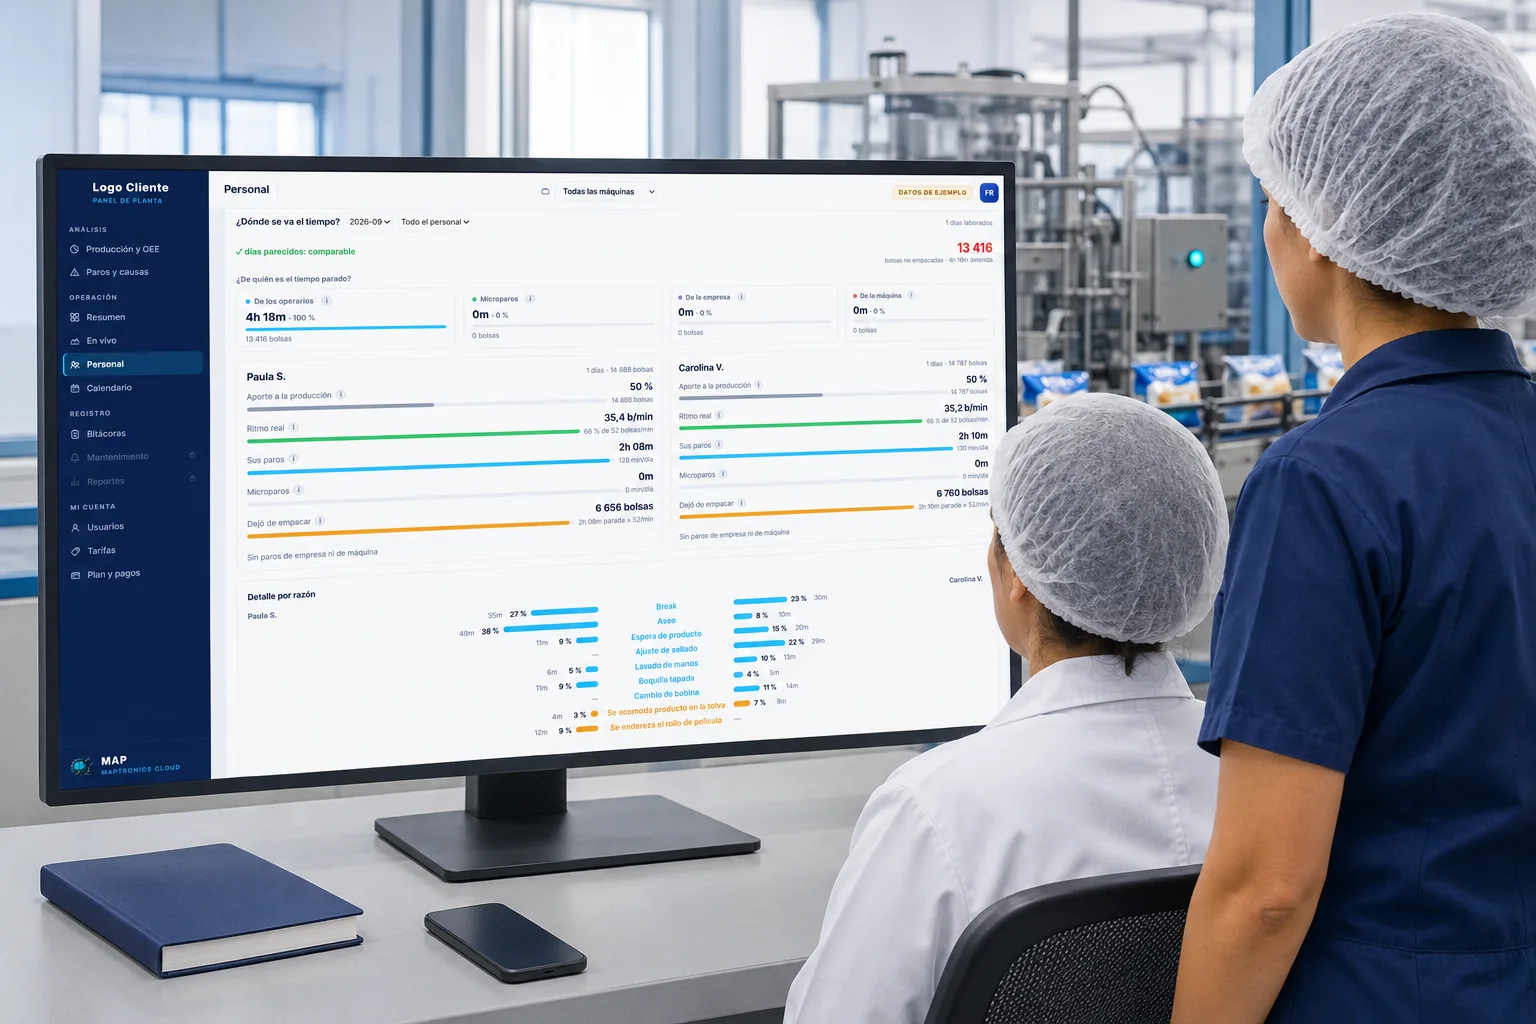
Supervisor reviewing the People screen of the Maptronics platform
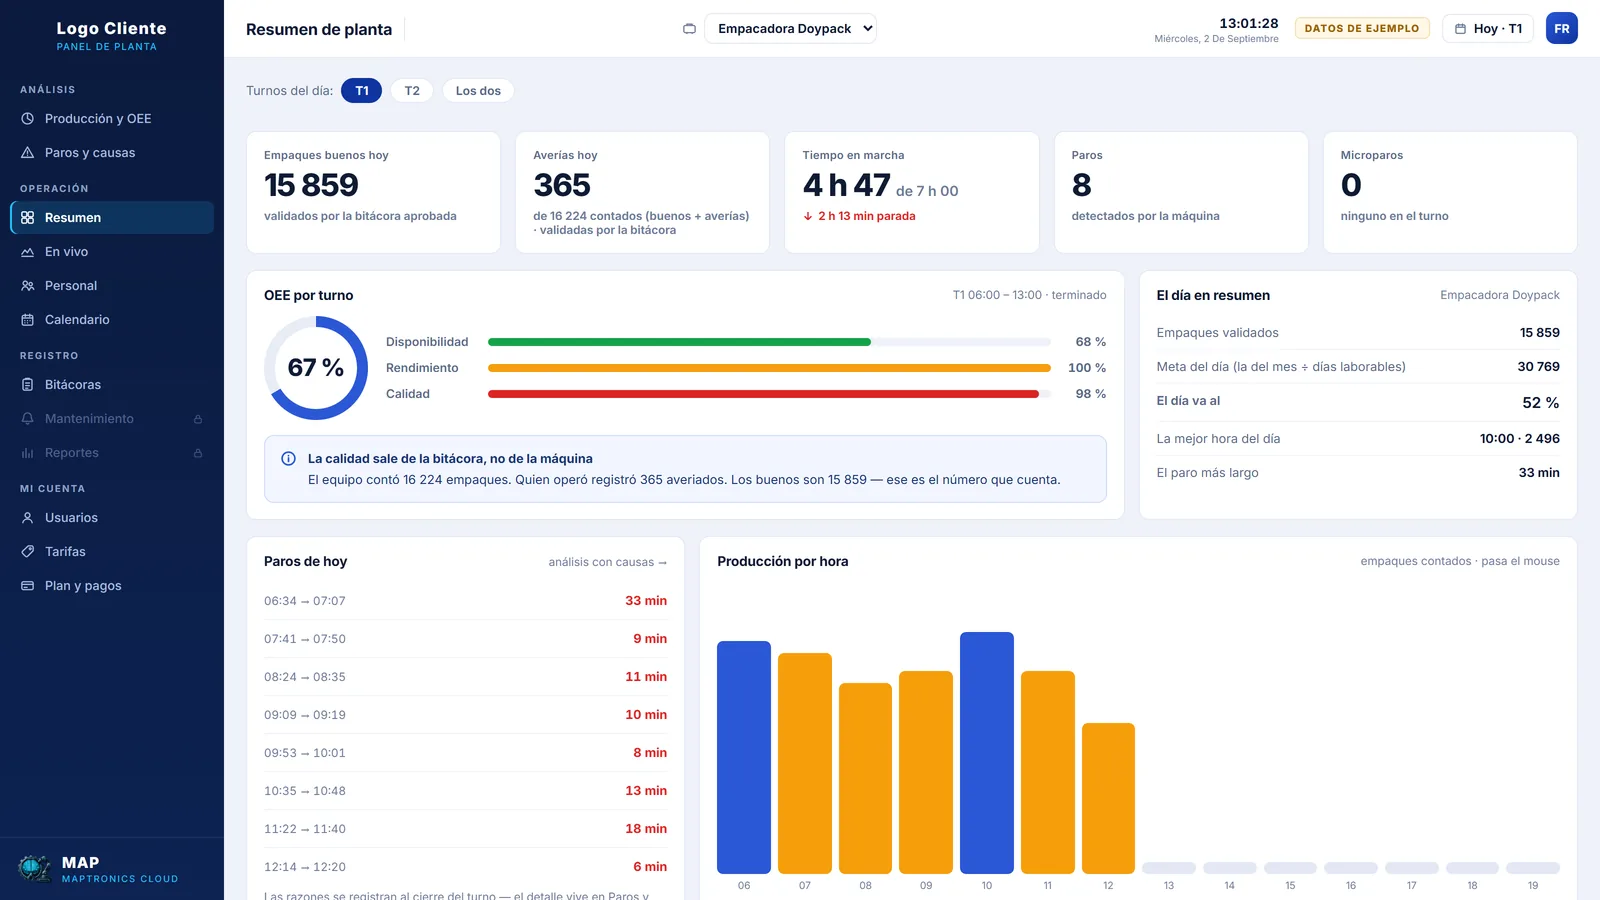
Plant summary: How is the shift going?
Plant summary

How is the shift going?

Validated units, running time, shift stops and the OEE with its three components, in a single view.

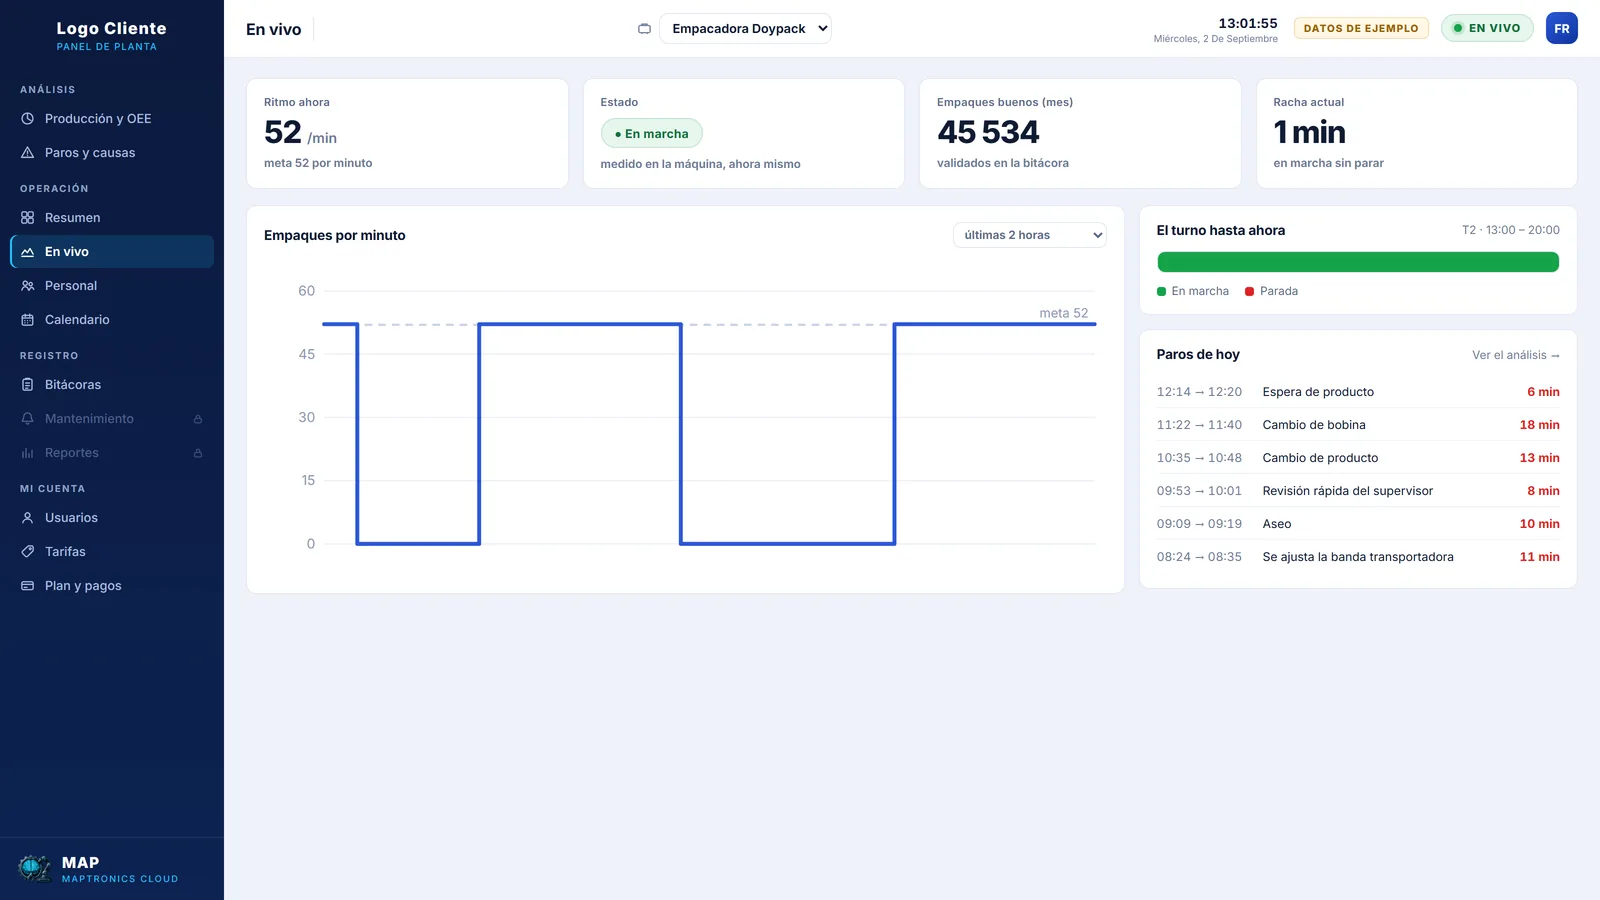
Live: Is it running right now?
Live

Is it running right now?

Current rate against nominal, status measured at the machine, the current run streak and the line for the last hours.

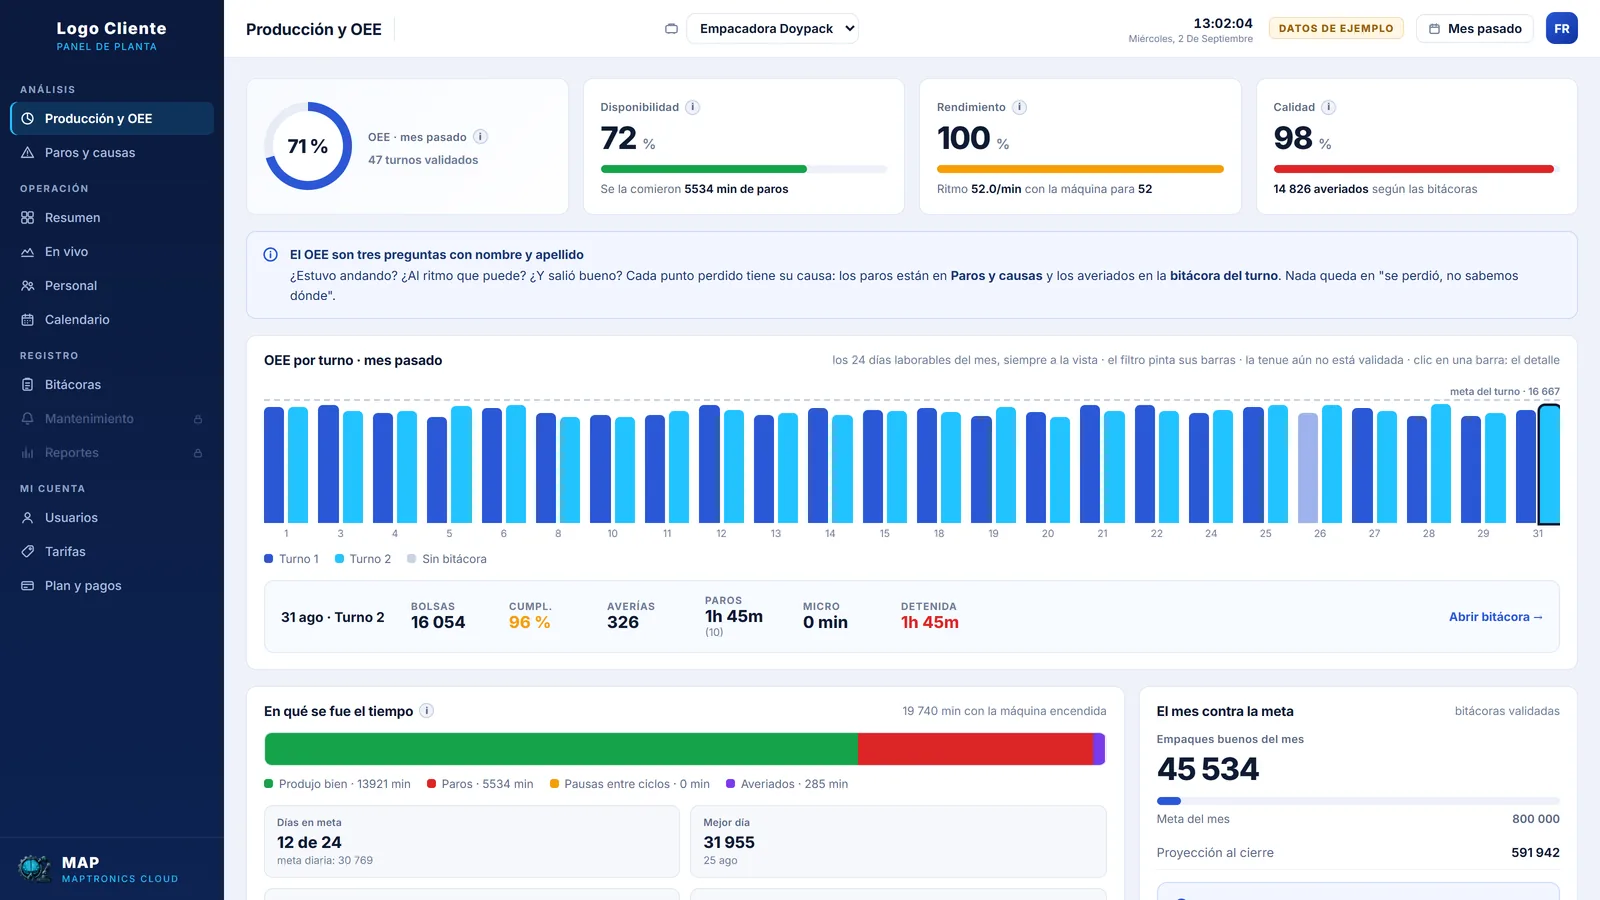
Production and OEE: Where did the time go?
Production and OEE

Where did the time go?

The month’s OEE shift by shift, and the split between good production, stops and rejects.

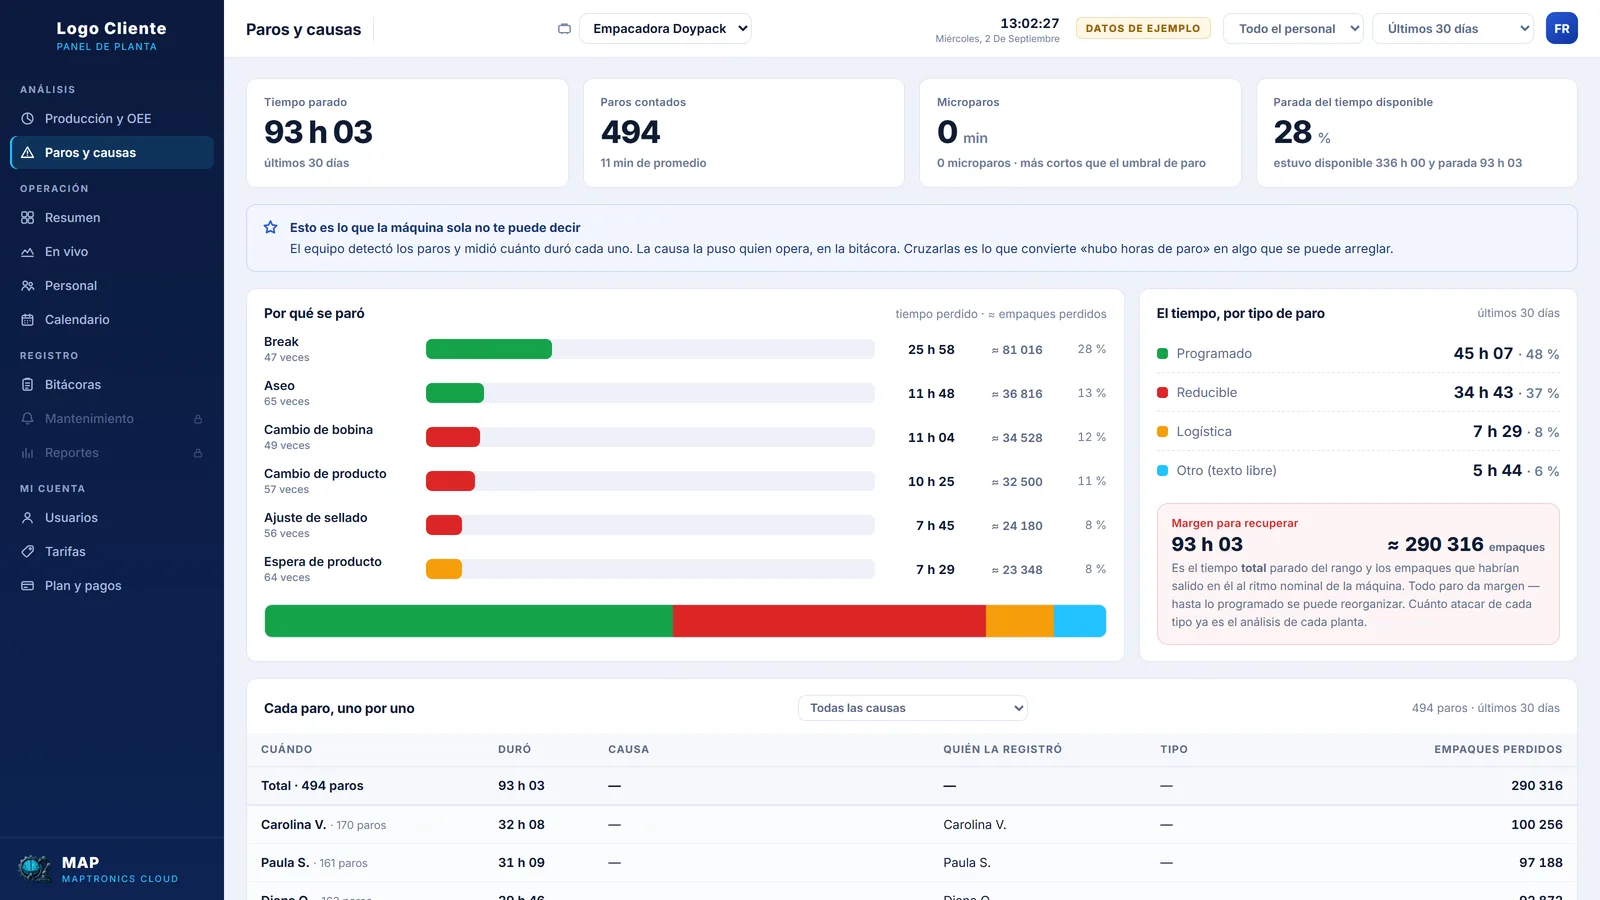
Stops and causes: Why did it stop?
Stops and causes

Why did it stop?

Every stop the machine detected with the cause the operator recorded, and how much of that time is scheduled, reducible or logistics.

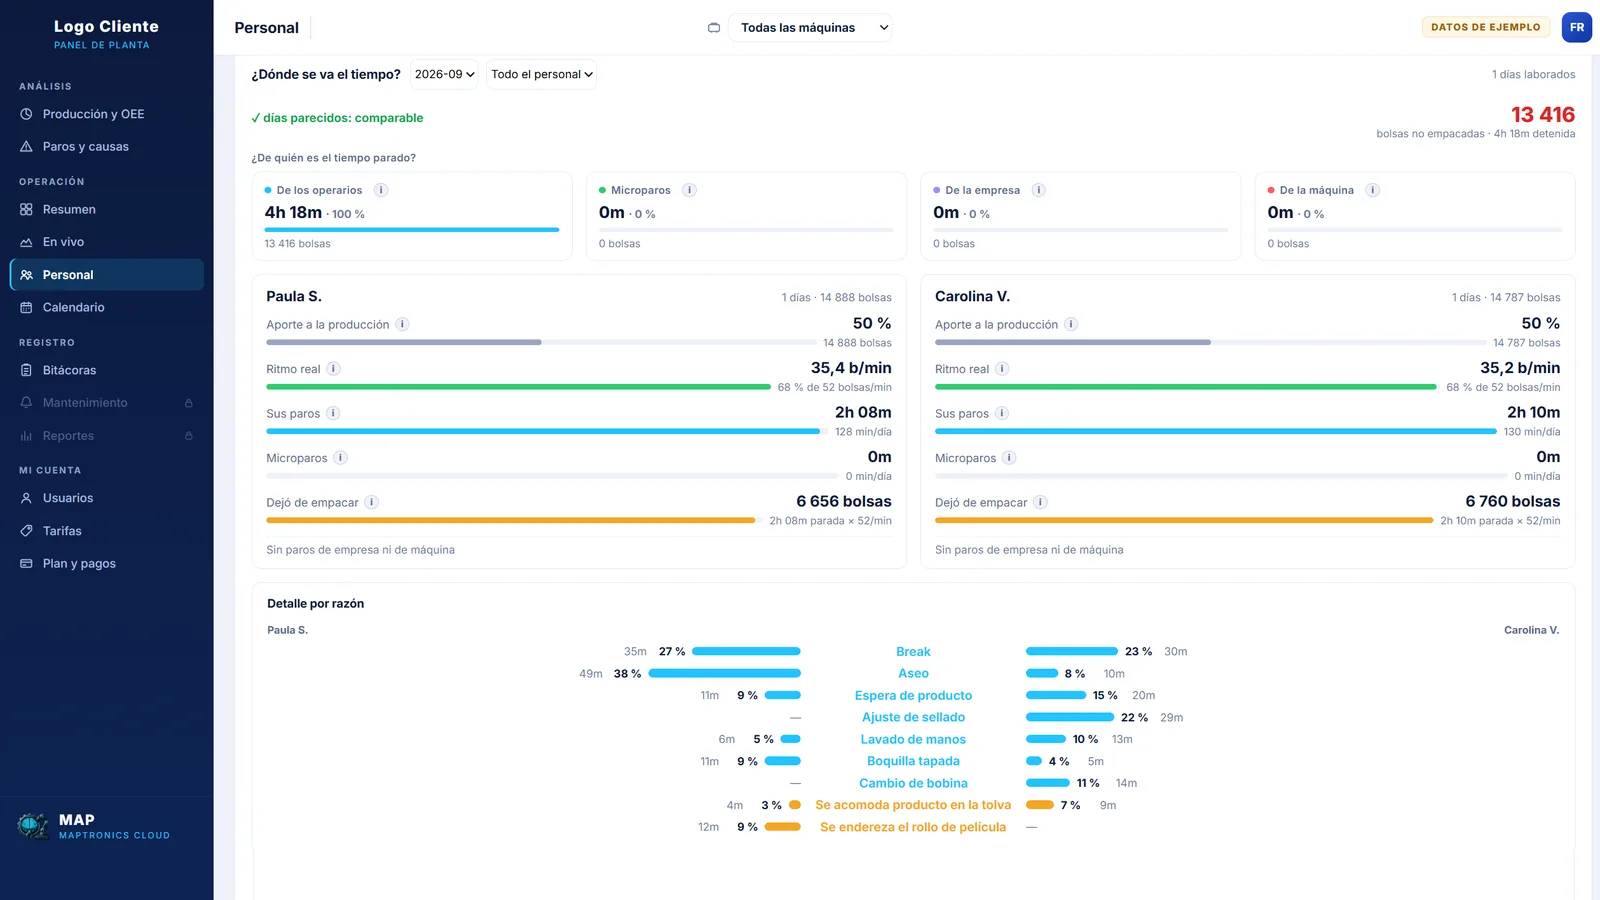
People: Whose is the stopped time?
People

Whose is the stopped time?

Separates stopped time by operators, by the company and by the machine, and shows each person’s contribution and real rate.

Logbooks: What did the shift record?
Logbooks

What did the shift record?

One logbook per shift with who operated, good and rejected units, and who approved it by name.

Where does your data live?

It is every manager’s first question, and the answer is short: in a private space of your company, operated by us.

A private space per client

Each client has its own dashboard and its own users. Your production data is not mixed with anyone else’s and is seen only by whom you decide.

Operation and backups on us

We maintain the platform, the backups and the updates. You log in and use it, with no servers to manage.

Communication between your plant and the platform travels encrypted.

Frequently asked questions

Does the platform work with old machines?

Yes. A machine with no data output is connected with our industrial gateway, without touching its control. If the machine produces units, it can be monitored.

Do I need to install anything to use the platform?

No. The platform is web-based: you enter from the browser on your phone or computer, without installing programs on your equipment.

Is my data mixed with other clients’ data?

No. Each client has a private space, with its own dashboard and its own users. The demo dashboard on this site is a simulation with sample data.

What does each person on my team see?

What their role needs: operators record, supervisors review and approve, and management consults the dashboard and the reports. Permissions go by role, not by trust.